How to predict website traffic in 4 steps
We made website traffic prediction models (suitable for smaller websites) in Python and placed output to Data Studio for live monitoring. Read this article for more information.
Posted by: Robert Dzudzar
Read Article
How to predict website traffic in 4 steps
What is website traffic, and why do we want to predict it?
In essence, website traffic refers to web visitors who visit a website. If your website is connected to a Google Analytics account, at minimum it will collect data of Sessions and Visitors. If your website is connected to a Google Analytics account via Google Tag Manager then you can track additional events, for example interactions with your content and most importantly Conversions.
When you have a business website, it is important to track and analyse website traffic in order to try to understand your business' effectiveness. In addition, you want to know if your website traffic went up or down over a certain time period, and of course you want to know your future website traffic. Since, no one can really look and see the future, how can you then predict website traffic? Well, you can't 100% predict it, BUT, you can estimate it by analysing your current website traffic and making some assumptions. And no, you don't always need fancy machine learning models.
Note: This method is suitable for smaller websites that do not have an enormous amount of data. In the described scenario, we are using data gathered during a time period of a half a year, with ~10k sessions and visitors.
1. Know your website traffic data
Probably the most crucial step - you need data, but I assume you have that already. So, the next important thing you need is to know your website traffic data! What do I mean by “know your website traffic data”? You need to know which data to exclude: for example you may know you had bot traffic, you may know that certain dates should not be used, you also want to remove outliers etc. Additionally, it will help if you knew if there were website upgrades in a given time period. The more you know your website data - the more you can clean them and (assuming all goes well) the more accurate your website traffic prediction will be.
2. Model your website traffic data
Now, assuming you have nice and clean data (know that it will never be perfect), you can start modelling. How to do that? - If you ask Google, you'll find a lot of fancy machine learning and deep learning models. While such methods can be good, it doesn't mean that they are the answer for everything! Instead, I turned to linear regression.
Linear regression model with SciPy
Simply put: linear regression is a statistical method which tries to model the relationship between two variables by fitting a linear equation to the data. A linear regression line is presented with an equation: Y = a + bX
- Where Y and X are variables, a is the intercept (the value of Y when X=0), b is the slope of the line.
Knowing my way around the programming language Python, I've used it for modelling. I've decided to model Sessions over a time period, using well known Python package SciPy (Scientific Python), using its linear least-squares regression (lingress)
The simplest way of using SciP's linear regressions is shown below, where Days and Sessions are variables that we want:
from scipy.stats import linregress slope, intercept, rvalue, pvalue, srderr = linregress(Days, Sessions) Once the fit parameters are obtained we then literally have a linear equation which we can use to extrapolate Sessions to the next time period.
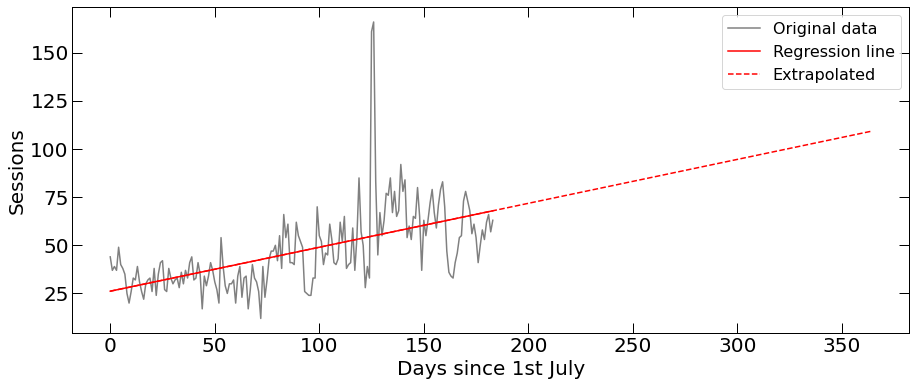
Website traffic: the grey line shows Sessions (real data), the solid red line shows fit to the data and the dashed red line shows fit extrapolation.
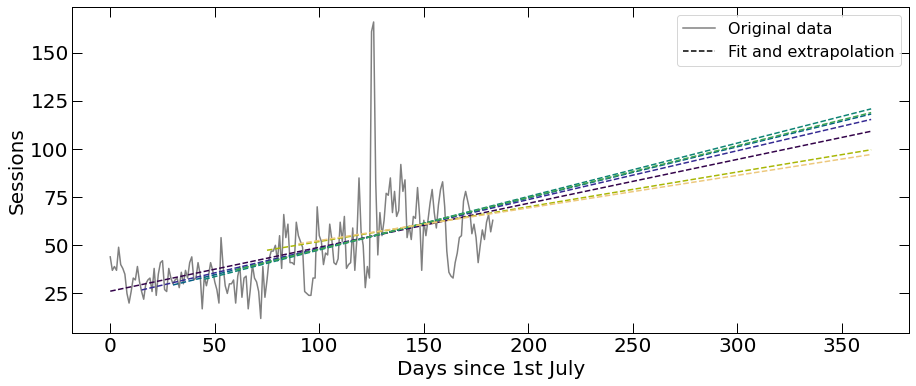
However, this is where “know your website traffic data” comes into play. I know that the website had upgrades, therefore I know the outlier (excluded from fitting, but shown in data). So, instead of choosing one start - 1st July (because what would be the reason to do this?), I've decided to create multiple models, starting with various days to avoid choosing one date. As a result I can see how the start date impacts the modelling, and I decided to use a model with an average slope, as well as those with the lowest and steepest slopes. Of course each model will have its own uncertainty - but since this isn't a high precision measurement - we are just going to keep this in mind.
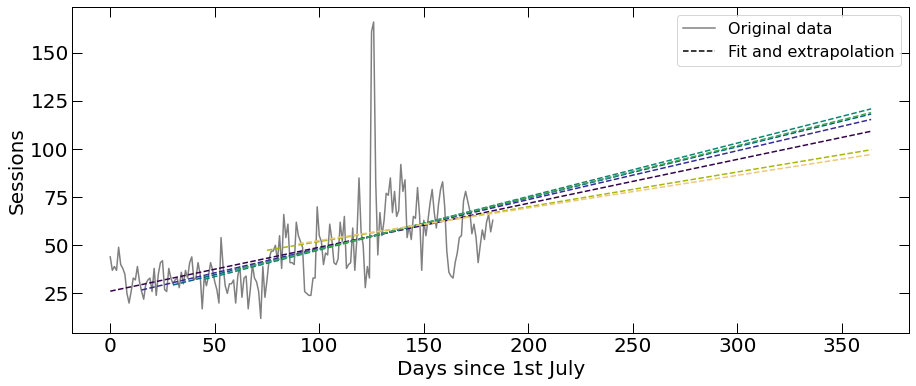
Website traffic extrapolation: showing different models obtained by fitting the data with varying start day. The grey line shows Sessions (real data), and the dashed lines show different models.
Having modelled Sessions, we will not model other variables in the same way, instead, we will try and see how desired variables relate to the Sessions, and we will model that dependence. For example page views:
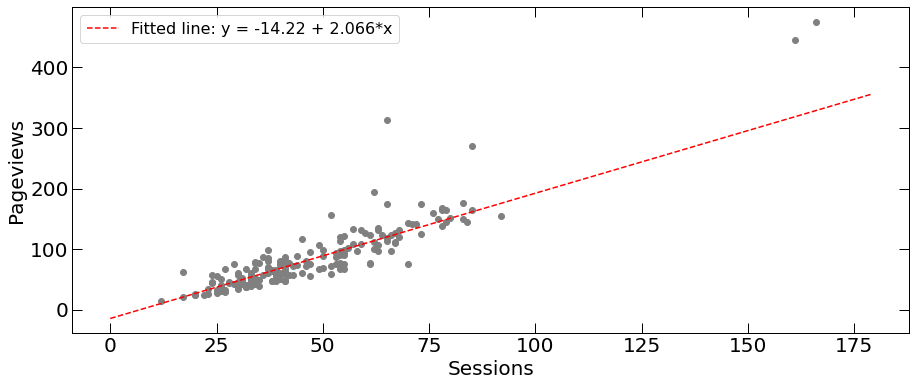
Relationship between page views and sessions. The grey points present real website data, the dashed red line shows fit.
Having a linear model between page views and sessions, we can now use the obtained equation and approximate page views by using sessions data obtained from our 1st model.
Caution: Correlation is not causation! Be careful when looking into properties such as Conversions, or interactions with certain website elements. In such instances, you'll need to extract how many sessions had interactions/conversions, e.g. is that 5%, 10%, 50% and then use this data to extrapolate future sessions and future interactions/conversions (assuming they'll retain the same percentage of conversions).
3. Present your results in Data Studio
Since we now modelled our variables, and extrapolated them for the next half a year, of course we want to know what to expect and whether our models make any sense. We want to know if we predicted the website traffic! To do this, I've created a Data Studio dashboard where I can keep track of the current website traffic.
Data Studio dashboard tracks each website traffic variable with 3 components: A) Scorecard, B) Gauge and C) Time series chart. Here is an example of what it looks like for sessions and page views.
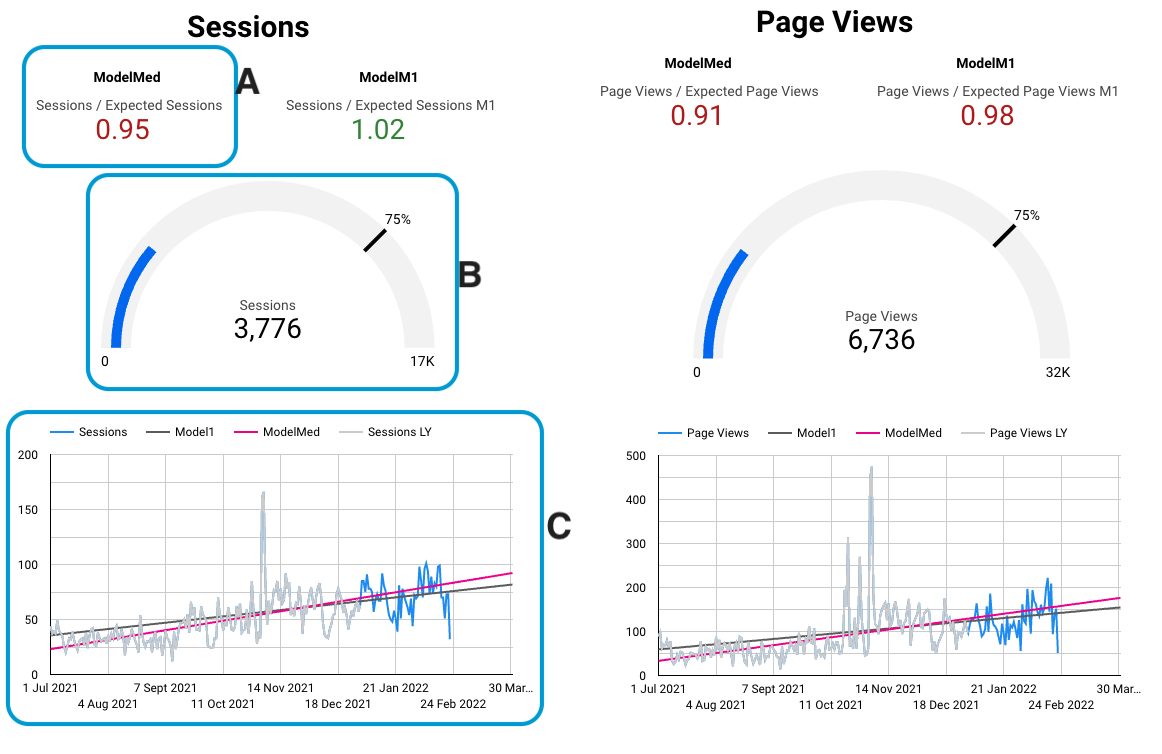
Data Studio dashboard components for tracking Sessions and Page Views - for real and modelled website traffic data. The A, B and C components are described below.
A) Scorecard: serves us as a number value for our website traffic prediction. It's made from the blended Google Analytics and model predicted dataset. It shows the ratio of real GA sessions and the model expected sessions (from 1st January to Today-1). It will turn red/green, depending whether the ratio is lower or higher than 1.
B) Gauge: the blue fill in the centre tracks the number of GA sessions from 1st January to Today-1. It's maximum value is the number obtained from the model, thus we are expecting to reach it. The black line shows where the 75% point is.
C) Time series chart: provides visual overview of the model and the real website traffic data. It's made from the blended GA and model predicted dataset. With the grey line I show sessions from past year - which I used for modelling. With the blue line I show sessions from this year which are NOT used for modelling. The black and pink lines show two models, so we can track visually how model lines relate to the incoming website traffic data (blue line).
4. Understand your results and limitations
Understand your data, your models and the obtained results!
Comparing the current sessions and page views to those predicted by model - we see EXCELLENT agreement. Yes, real variables will fluctuate, yes the ratio with respect to the expected variables can be below 1 - this is still GREAT. It shows that we are on track, and we can monitor how the new business changes will affect these expectations.
With such an approach, we modelled various website traffic variables and are now keeping track of the business progress and most importantly clients are aware of what they can expect in the near future (of course also being aware of all assumptions that went into the model).
To summarise
I've described how to predict website traffic in 4 steps, and shown results which validate this approach for smaller websites and businesses that do not have a large amount of data. Thank you for reading and feel free to get in contact if you want to know more.

Robert Dzudzar
Thanks for reading and I hope you have a wonderful day!